Project Overview
The whole job on a page or two: acreage, stands, plots, and the headline volumes and values.

Reports
Forest Metrix turns the tally into finished reports on the phone, before you leave the woods. Every report prints to PDF and exports to Excel, and you can add your own layouts, fonts and colors. Some reports depend on your plan; the plan comparison shows which.
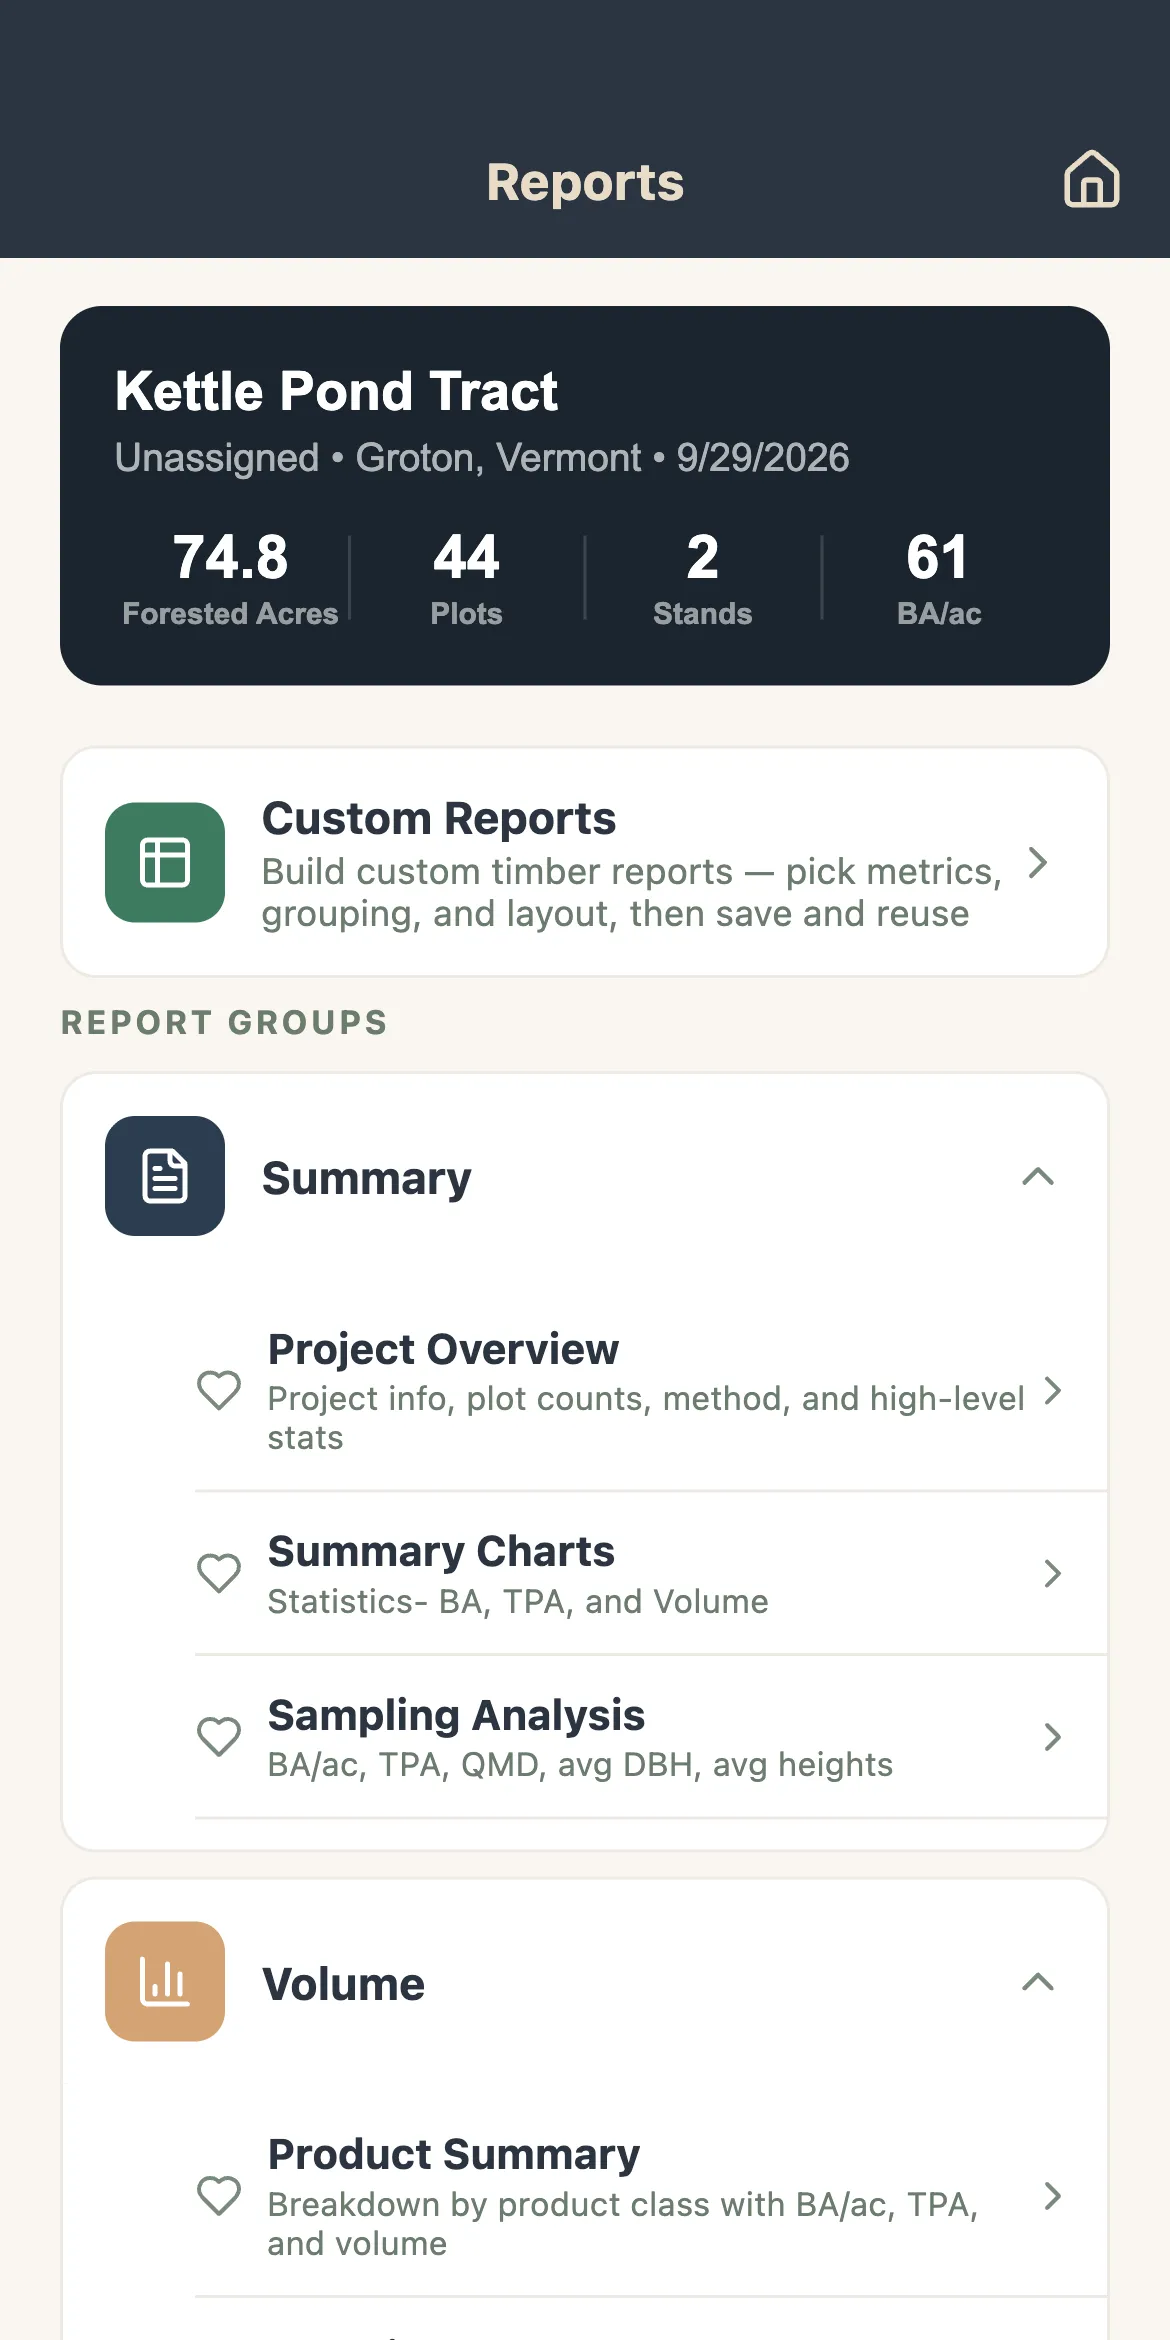
The whole job on a page or two: acreage, stands, plots, and the headline volumes and values.
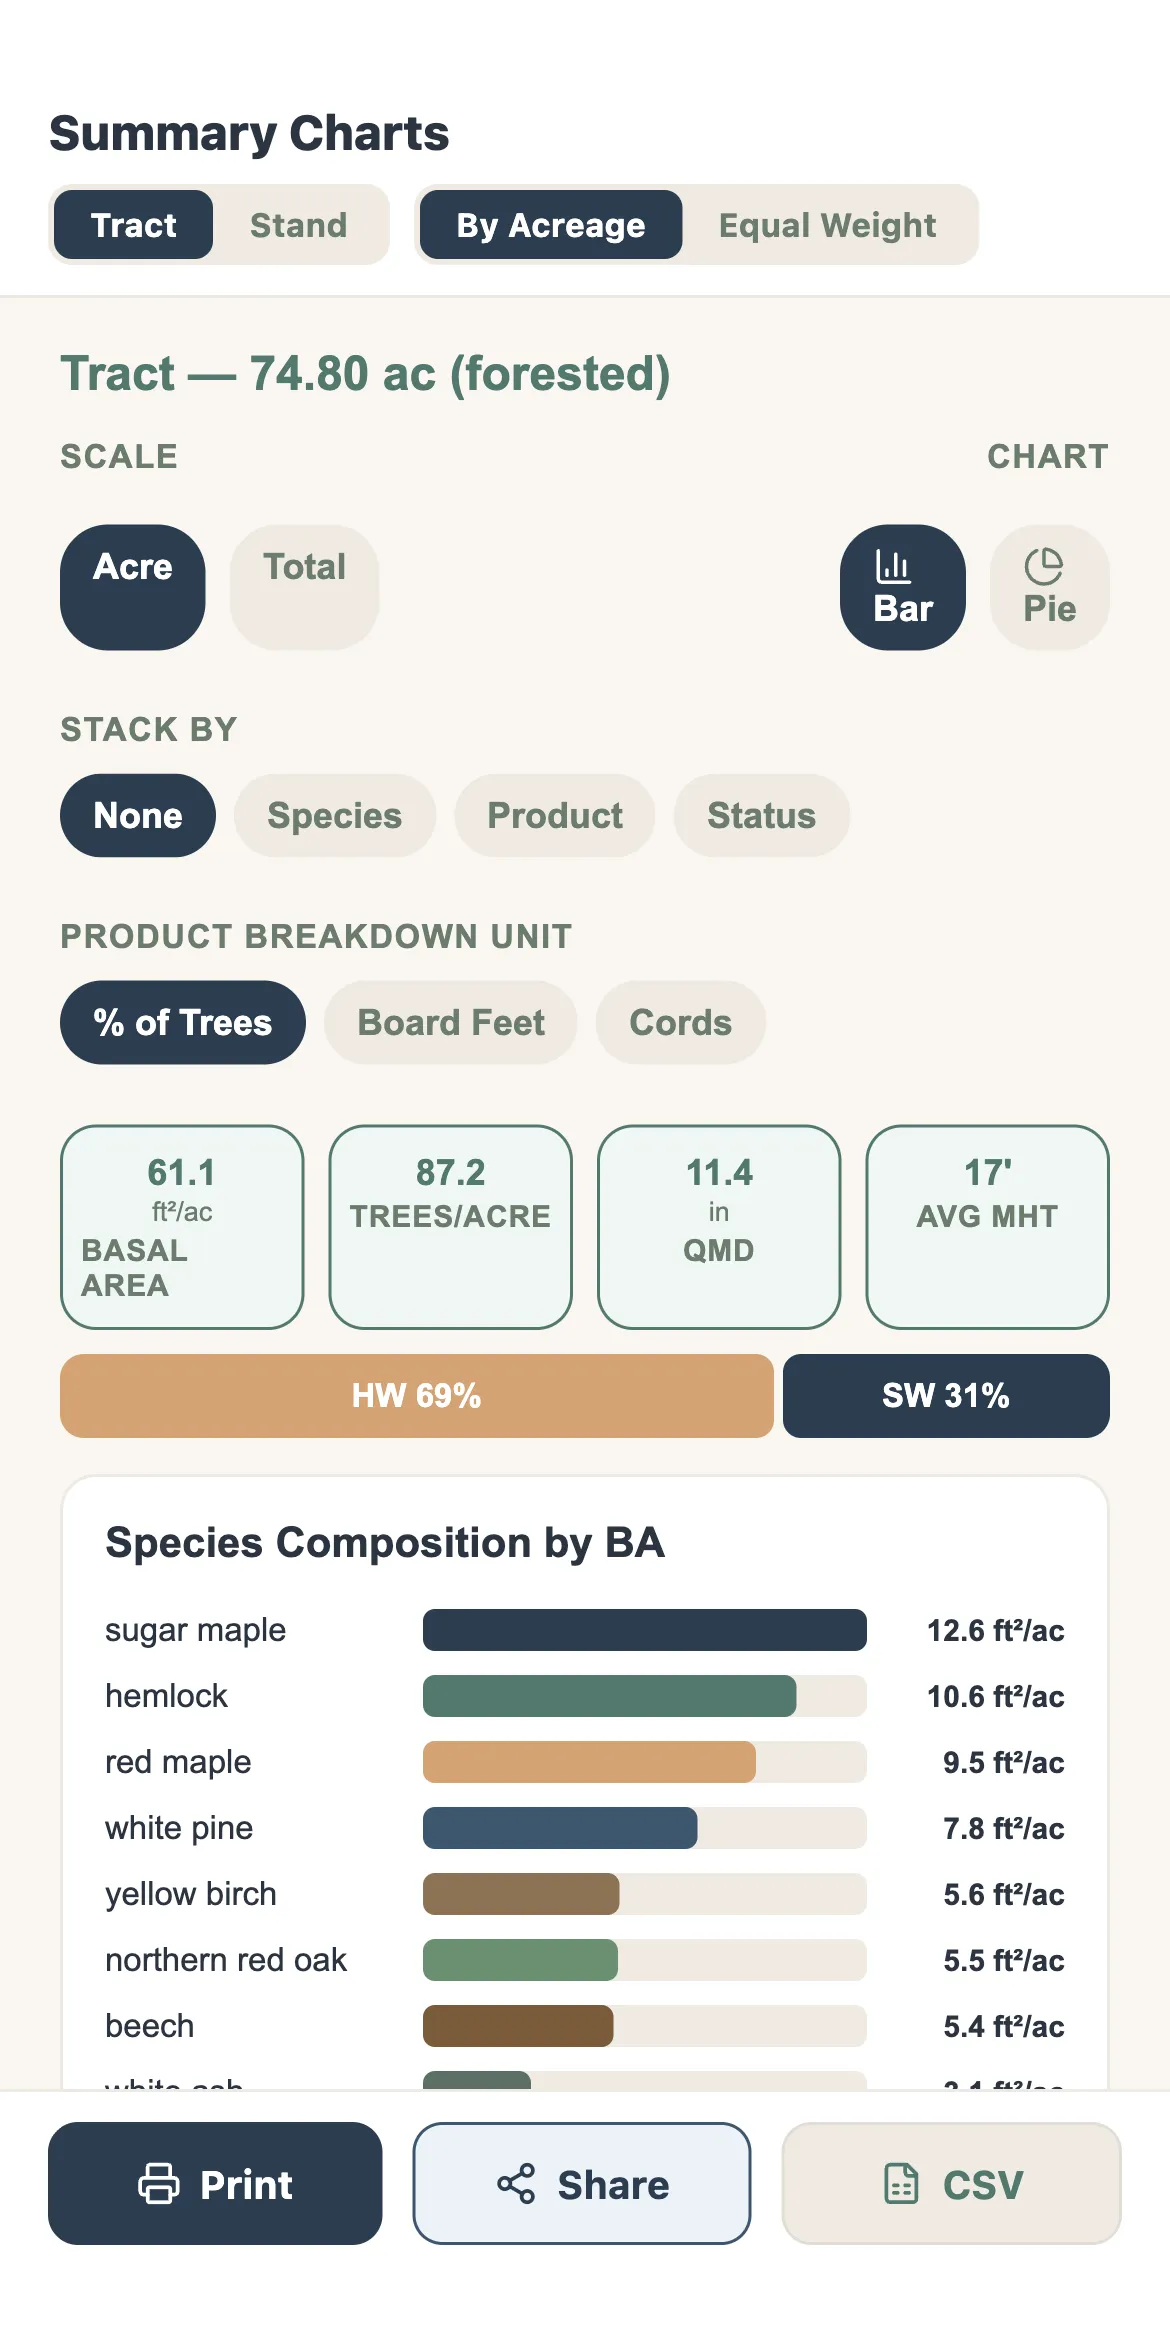
Species mix, volume by product and diameter distributions as charts your client can read at a glance.
Standard error and confidence intervals by stand, and how many more plots are required to reduce your error.
Volume by species and product, per acre and in total, gross and net.
Trees, basal area and volume by diameter class, species and product.
Trees per acre by diameter class and species.
Your stands plotted on the stocking guide for the forest type.
Relative density and stand density index by stand.
First 3 of 5 pages
Whole-tree biomass by species and component, in dry or green tons, carbon, and CO₂e.
Stumpage value by product, from your price list.
Value broken out by species and product together.
Every tree tallied, with the measurements and calls you recorded.
Notes and observations, plot by plot.
Basal area for every plot, for checking the cruise and spotting outliers.
Your own plot fields, listed and summarized.
Seedlings and saplings by species.
Volume and decay class, in total and by species.
Snags, in total and by species.
Beyond the standard set