
Timber cruising software
Walk out of the forest, and your reports are done.
Lay out the project, navigate, tally trees offline on iPhone, iPad or Android, and the reports are done before you leave the forest.
Runs on iPhone, iPad, Android and the web.
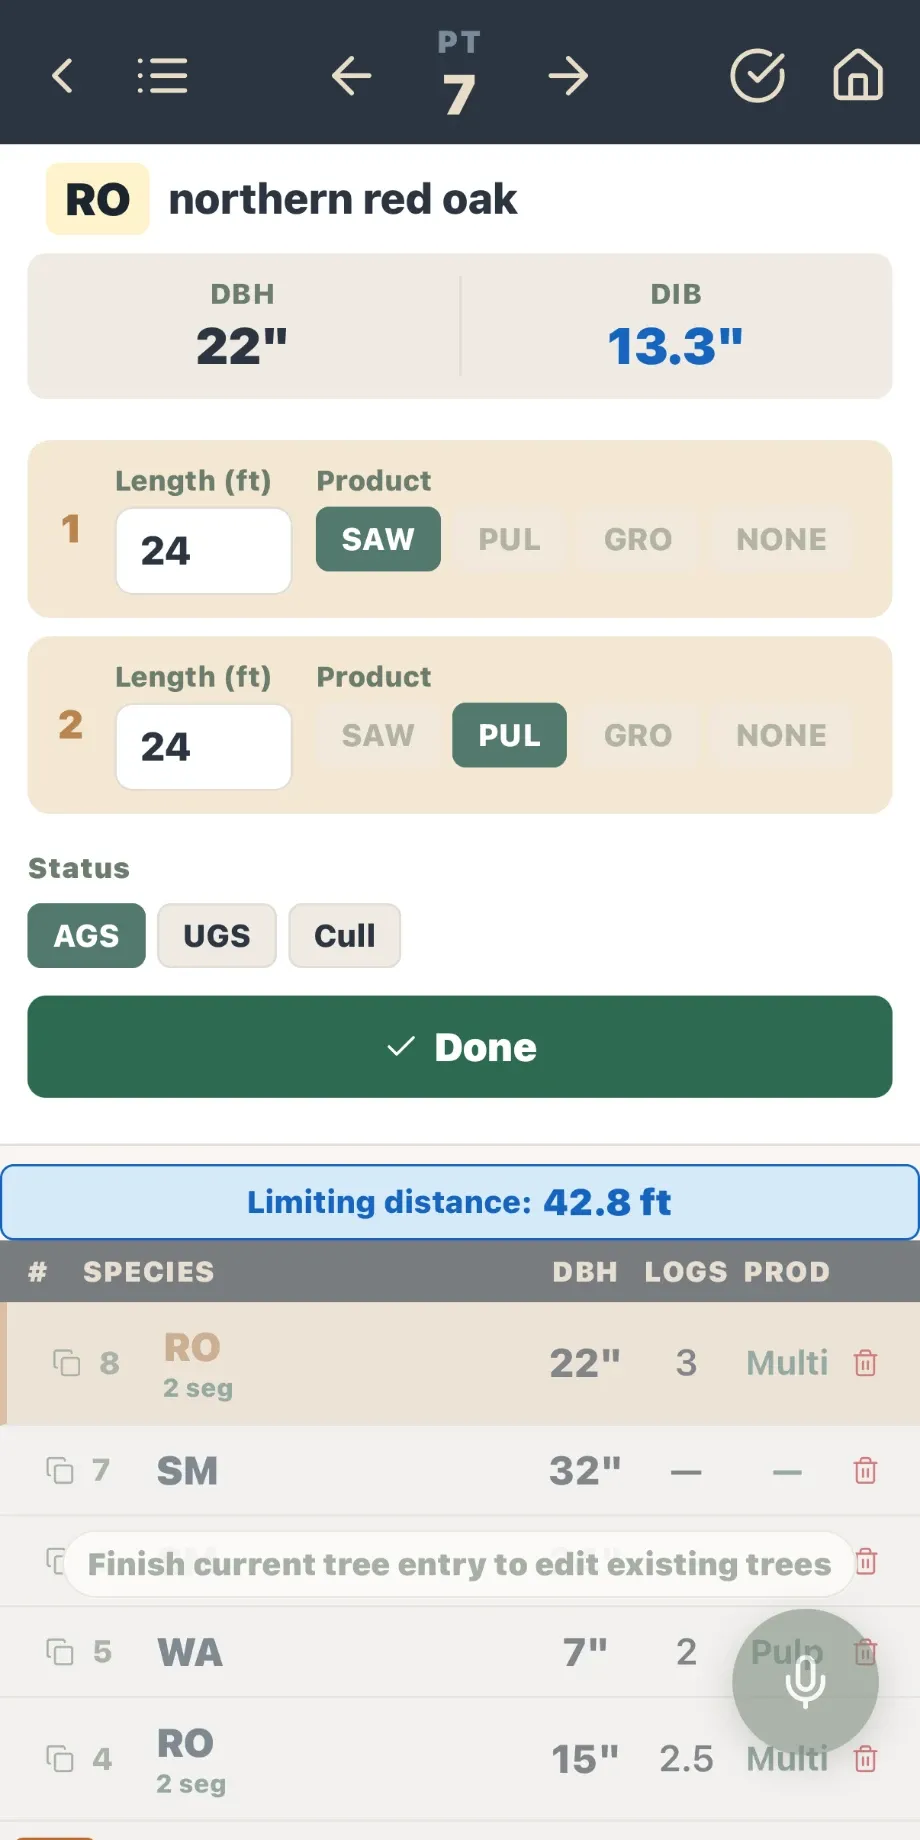
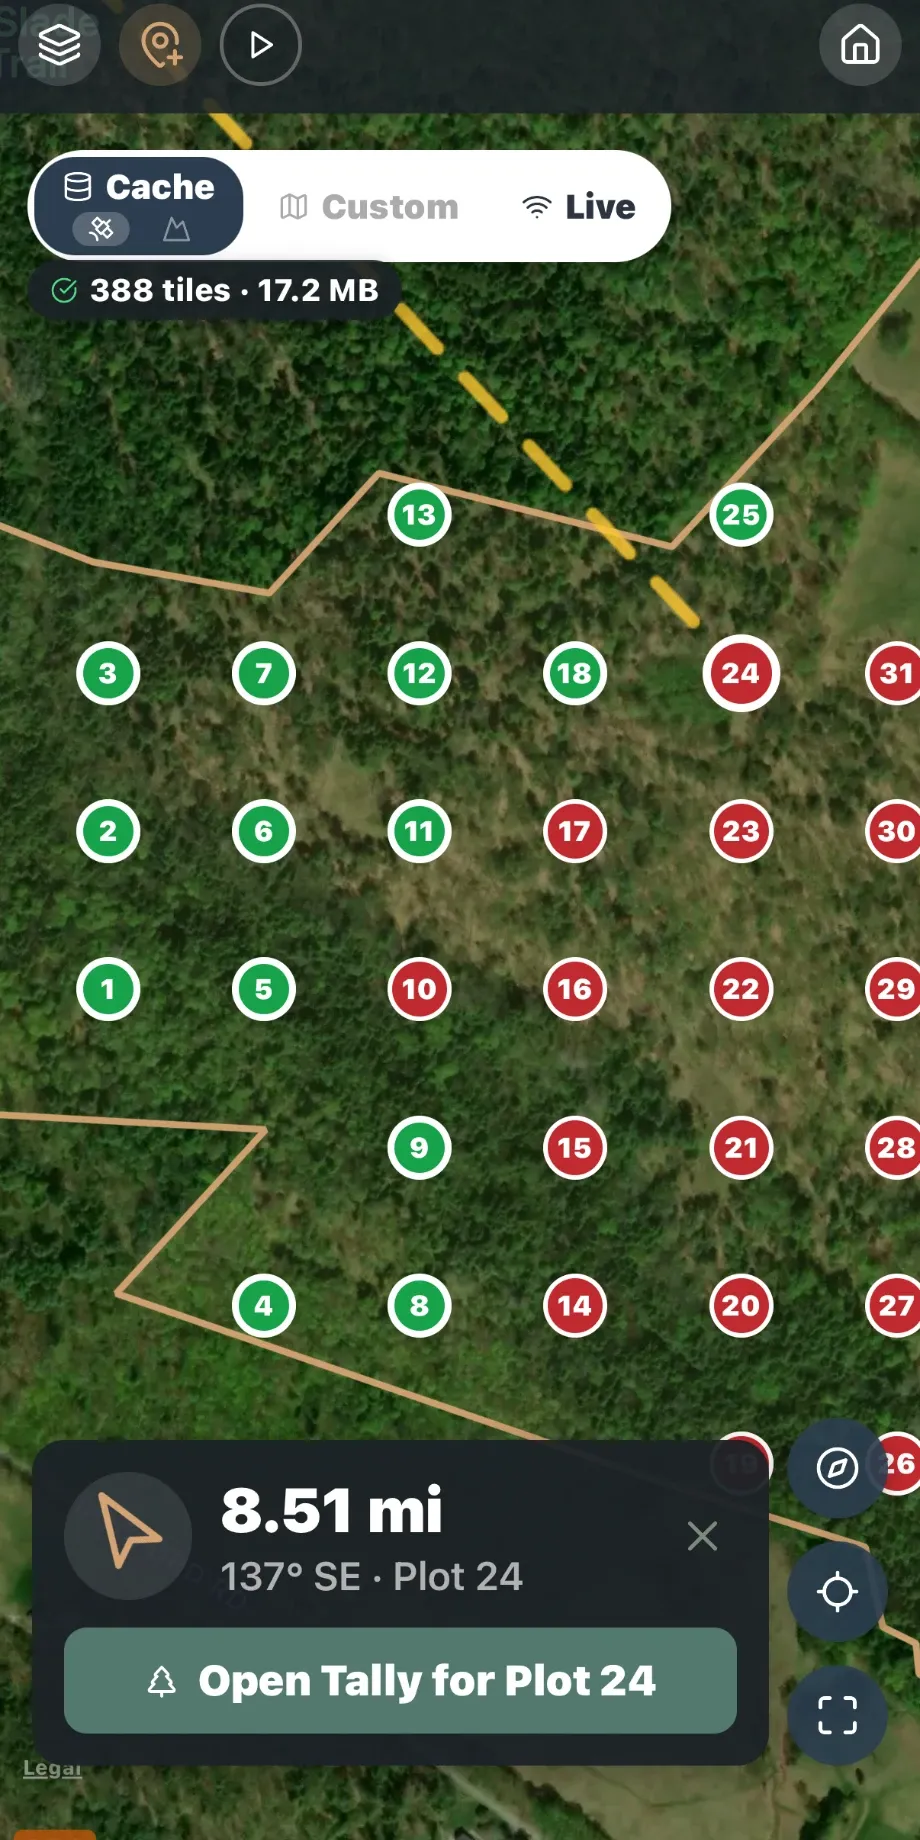

10,008 trees on 27,000 acres analyzed in 22 seconds.
In the field, with no signal, on an iPhone 17 Pro.
Plot to report
One app from the first plot to the last page of the report.
- 1
Plan the project

Select a tax map parcel to set the boundary, import a boundary from your GIS, or just start cruising. Split the boundary into stands and drop a cruise grid at your spacing and bearing. Forest Metrix can suggest how many plots you need for the precision you want.
- 2
Tally in the woods
The phone navigates you from plot to plot. At each one, tally by prism, fixed-area, double-sampling or 100%, plus Dot Tally and Voice Tally. Everything works offline.
- 3
Analyze and report
Stand and stock tables, product and value summaries, diameter distributions, stocking guides, carbon and more. Print to PDF, export to Excel, send the data on to SILVAH, NED-3 or FVS, or export to GIS.

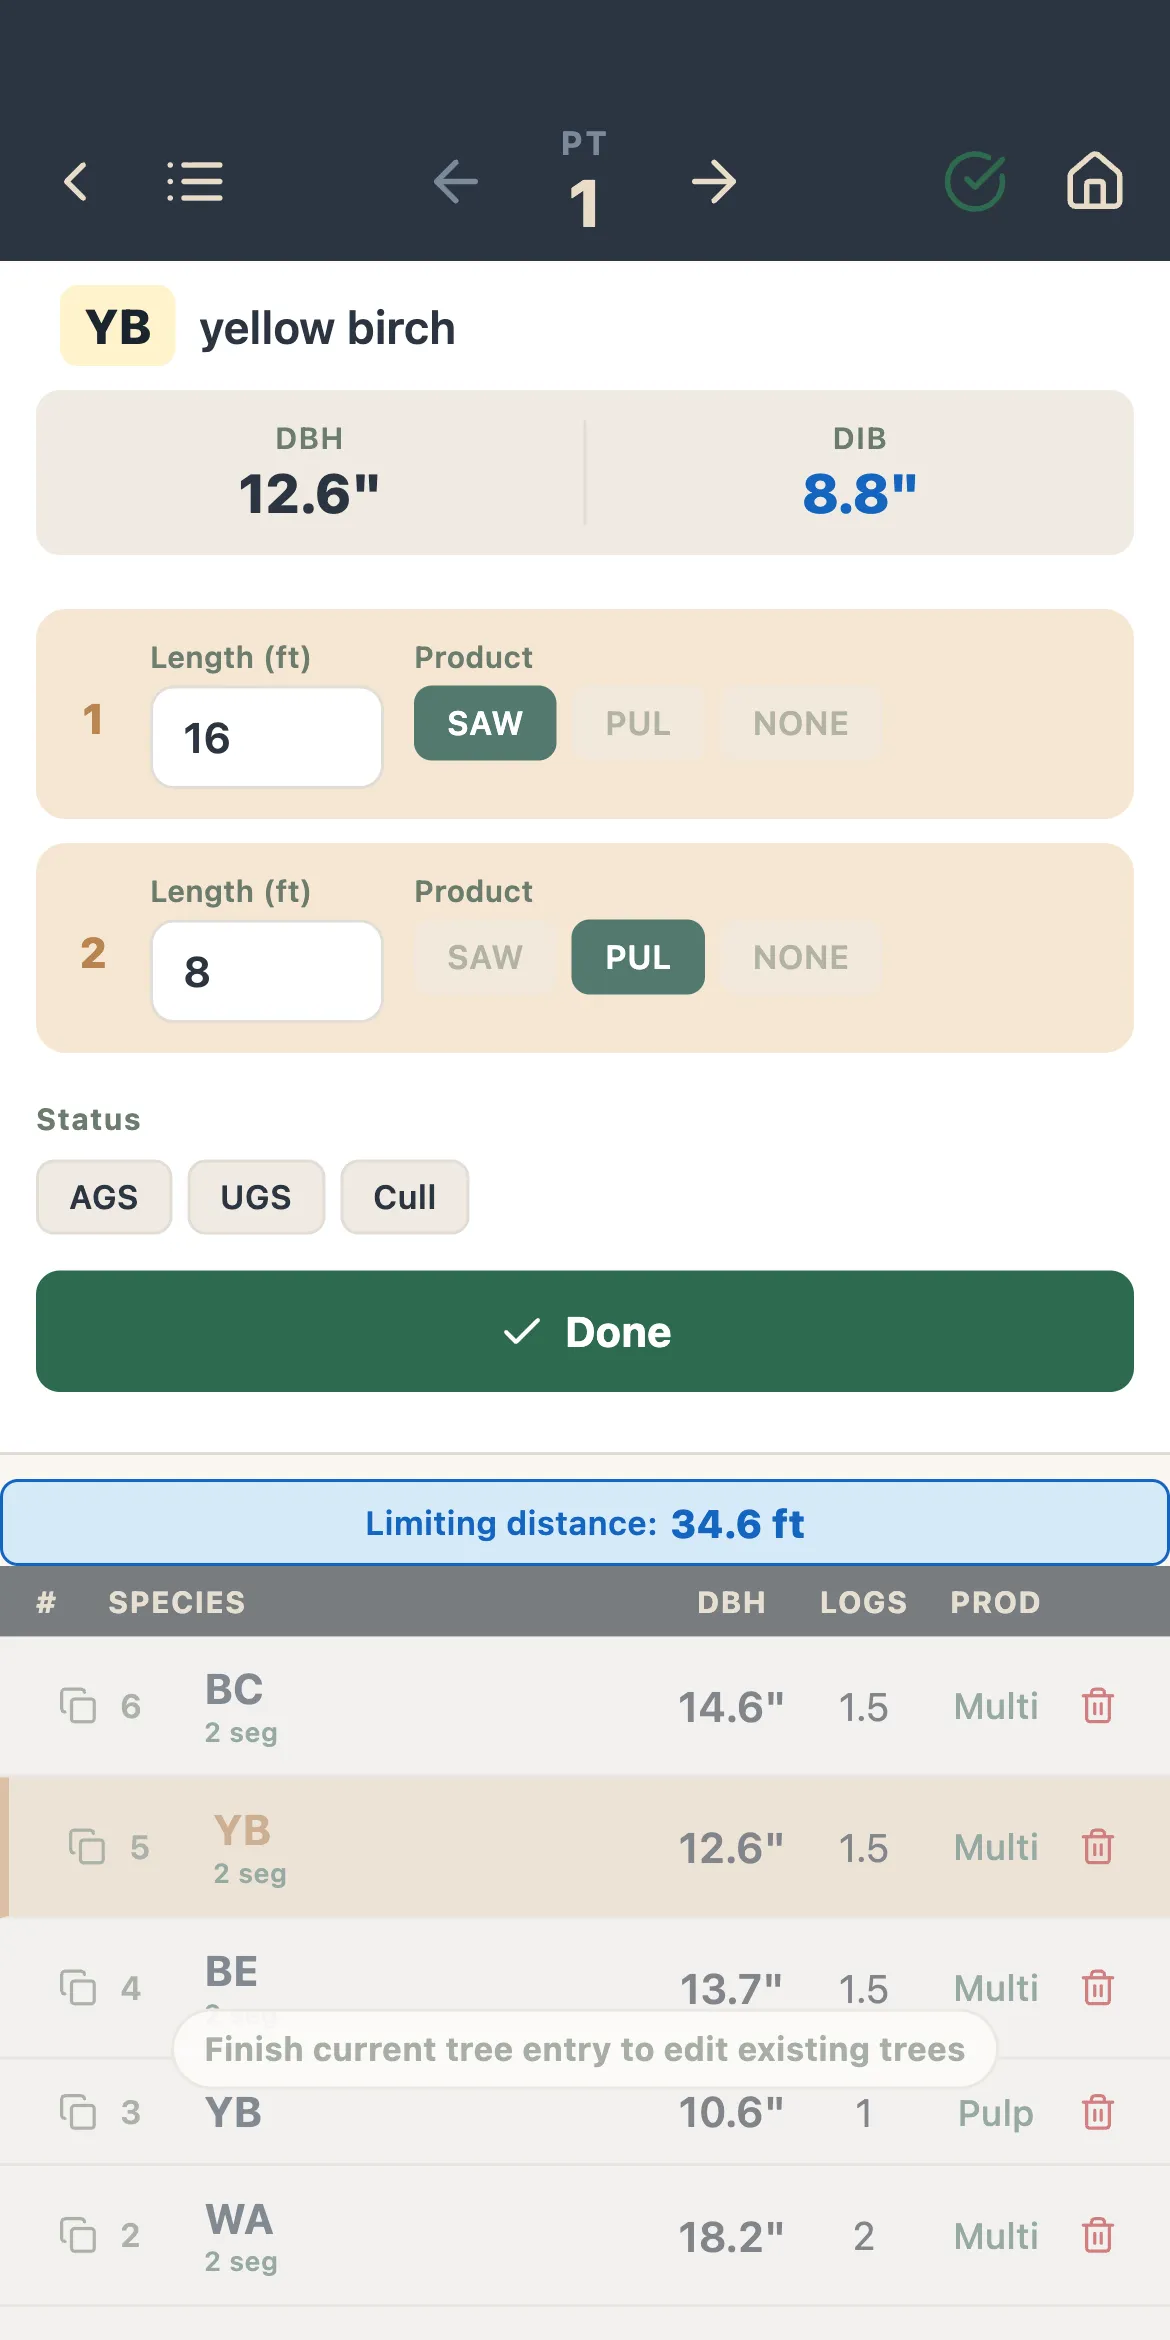
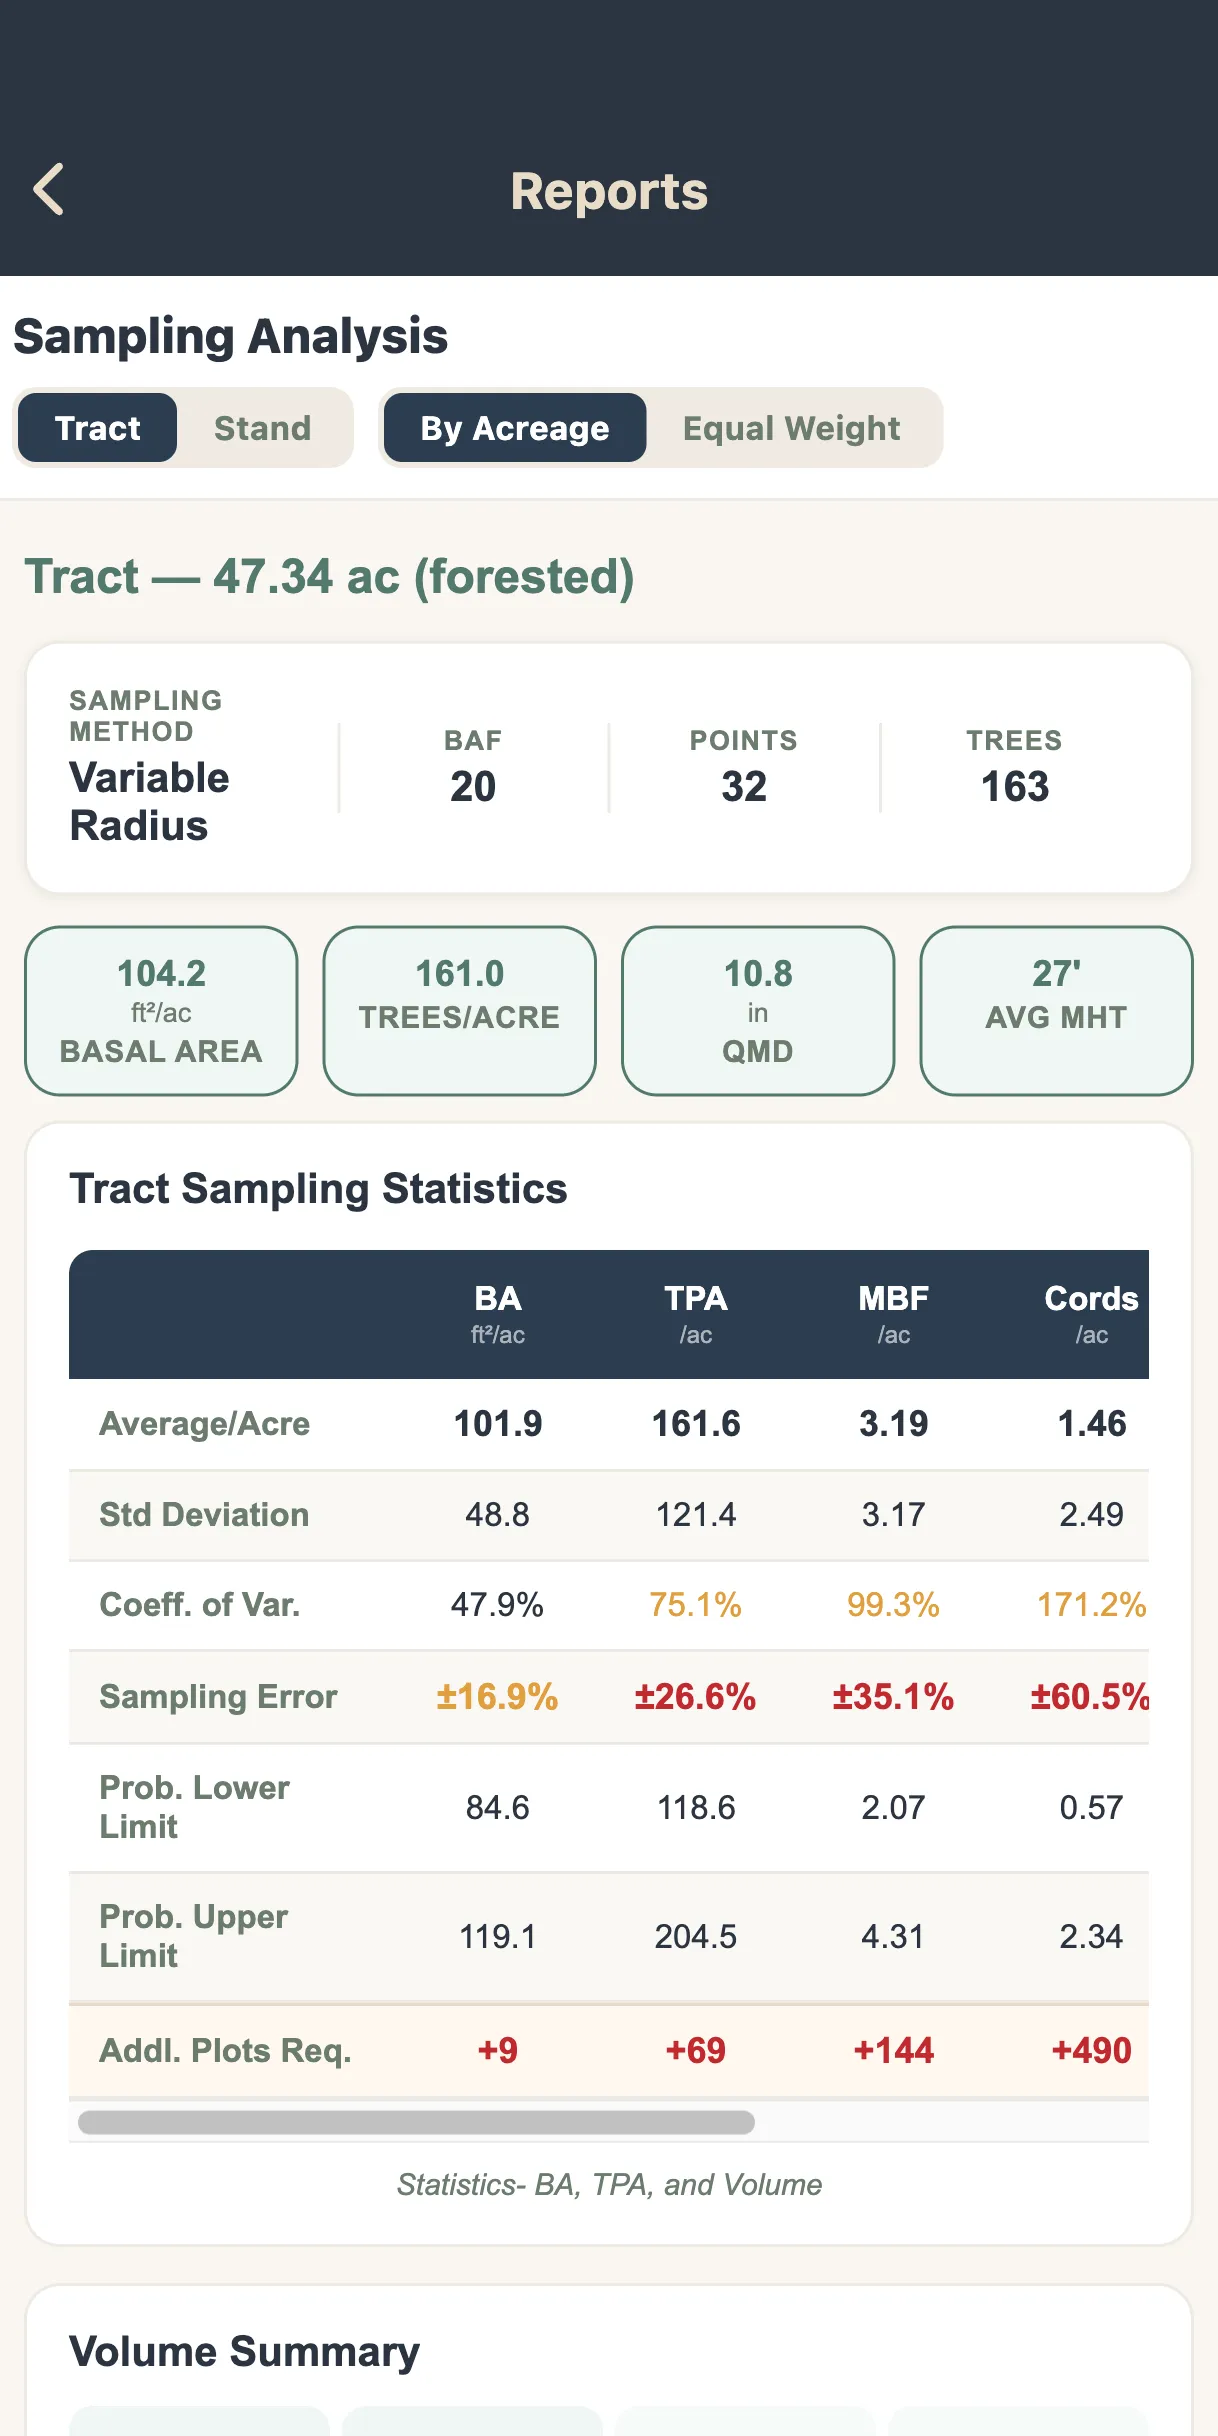
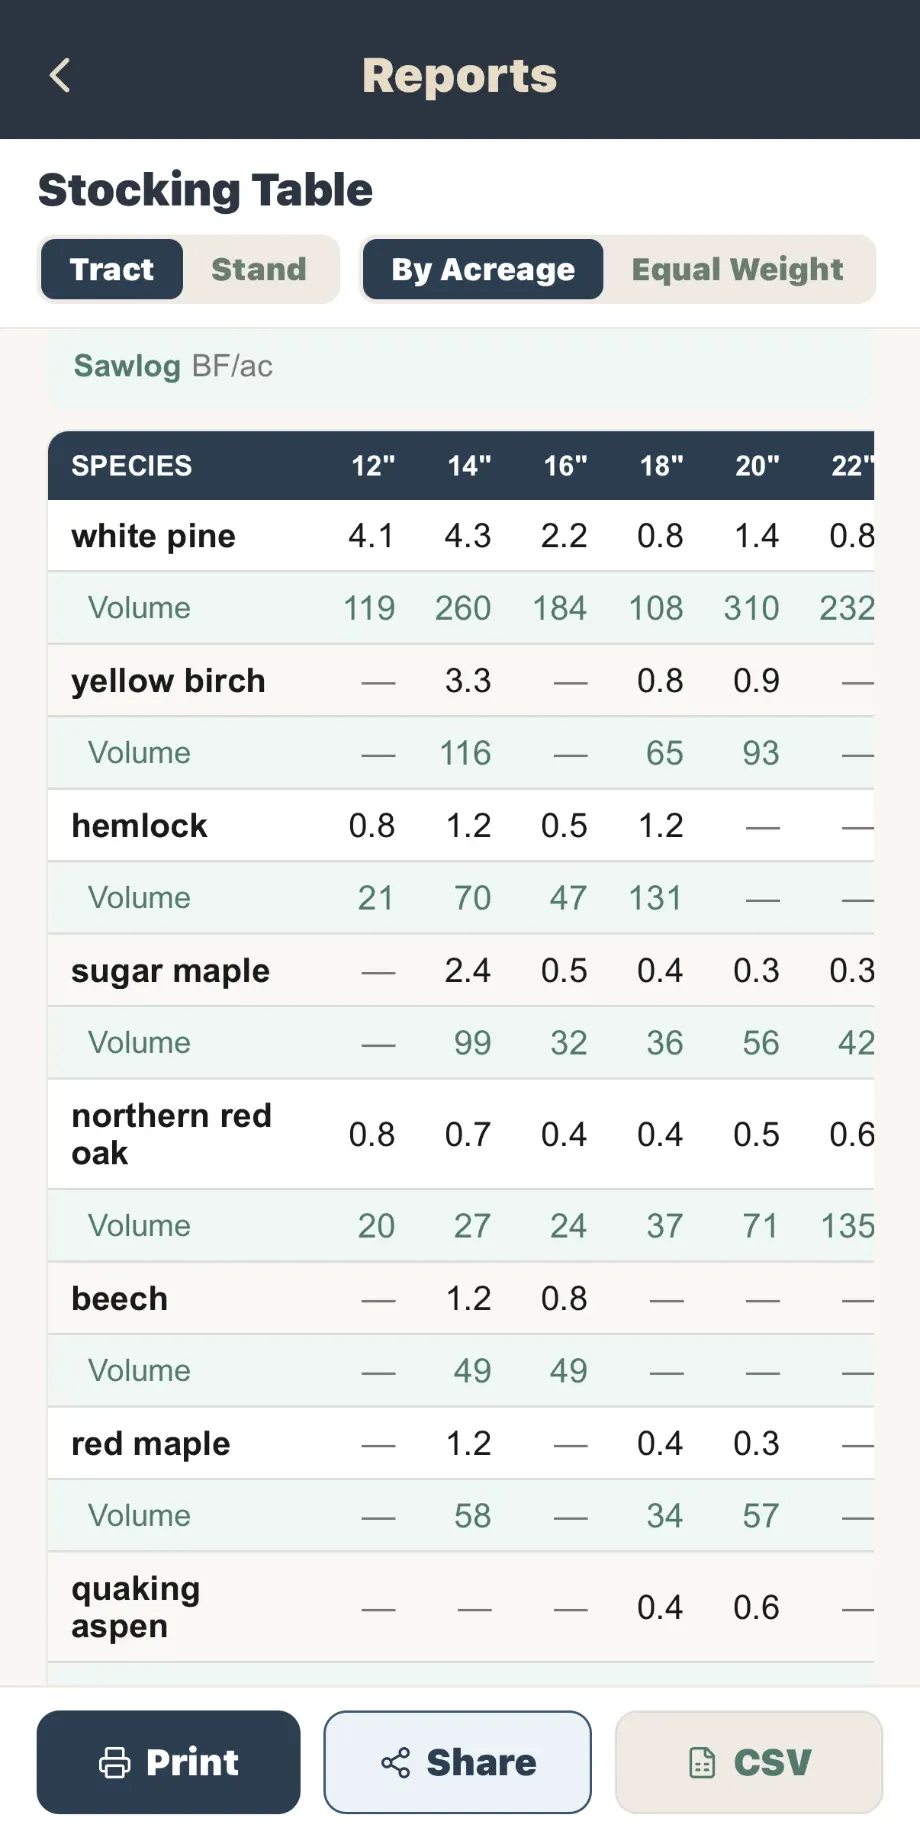
Swipe for more.
“This new version of Forest Metrix is absolutely the real deal. It is working extremely well and is reducing my field time and office time tremendously.”
“The map generation and cruise grid are great. Even a dinosaur like me can figure them out.”
“After working through mapping, data entry and getting to the reports, all I can say is Wow! You’ve made an excellent product for foresters like me.”
Maps built in
The map lives in the app now.
Your boundaries, plots and tracks sit on one map, with the layers a forester actually checks.
- High-resolution offline maps for the whole tract, saved before you lose signal
- NRCS soils with site index by species
- Parcel boundaries from county records
- Your own georeferenced PDF maps, offline too
- Waypoints, GPS tracks and stand lines you draw in the field
“The live mapping capabilities are fantastic, and being able to upload stand boundaries and plots directly is incredibly slick.”
Pricing
Three plans. Pay monthly or save with a year.
Basic
$59 a month
or $649 a year
Basic cruising & reports for simple projects like timber buyer cruises.
Pro
$89 a month
or $999 a year
Adds maps, custom data fields, full forestry reports.
Max
$119 a month
or $1,299 a year
Adds higher-res maps, one-click parcel boundaries from map, more map functions, custom volume rules, soils map overlay, GIS and GeoJSON export, and Voice Tally.