
Features
Everything from the first plot to the finished report. One app. Zero moving parts.
Some features depend on your plan. The plan comparison shows which.
In the woods
Optimized for the field.
Big targets, clear screens and a tally that follows your cruise method. It works with no signal, and it syncs by itself when you get one.
“Even a dinosaur like me can figure it out.”
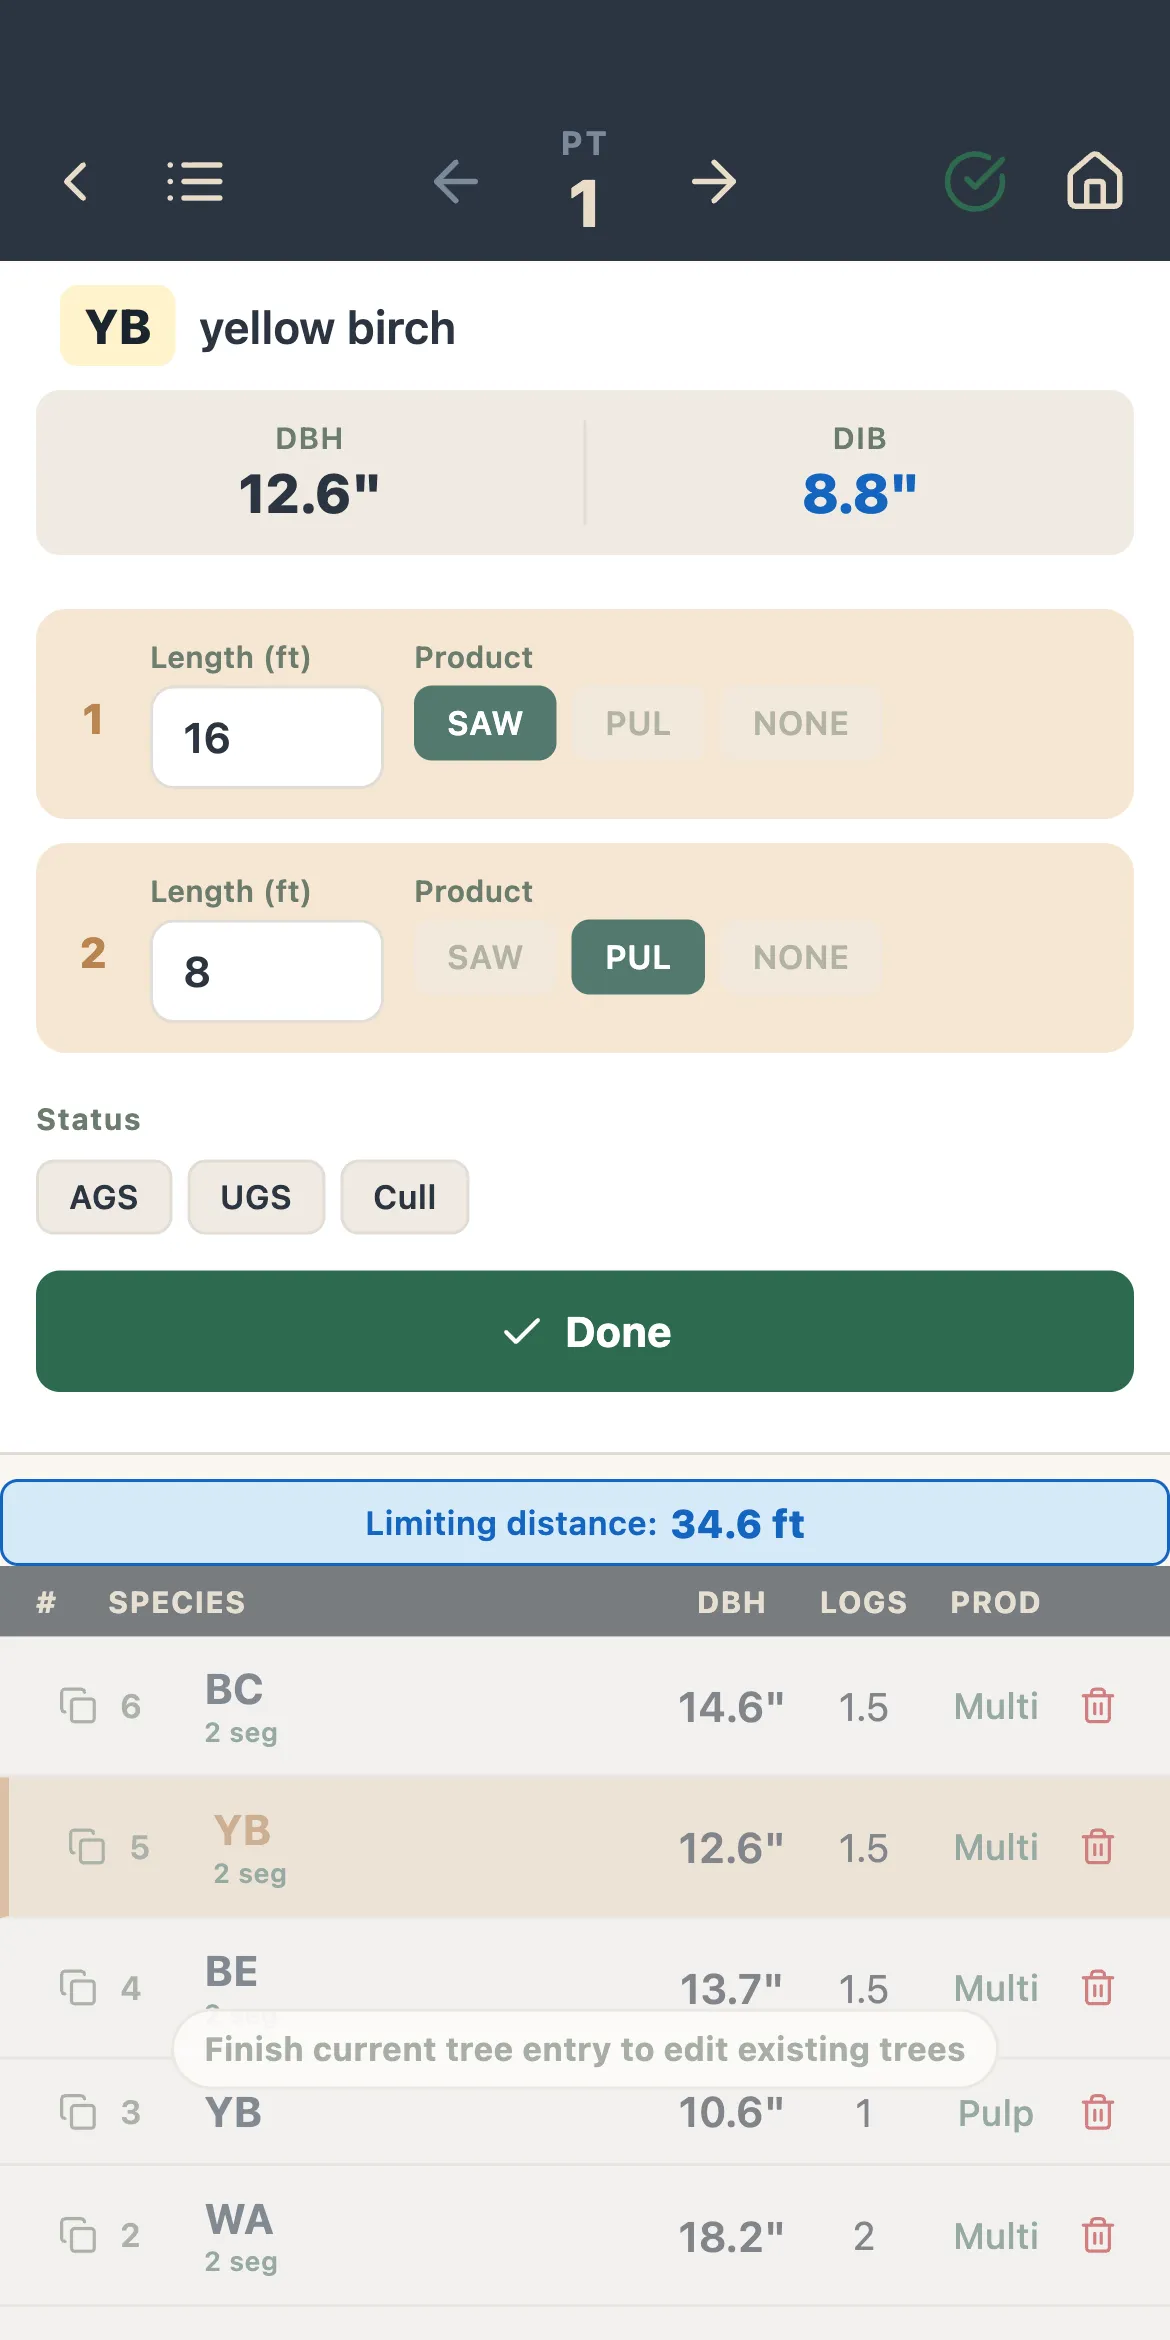
- Every common cruise method
- Prism plots at any BAF, fixed-area plots of any size, double sampling (big BAF), and 100% tally.
- Dot Tally
- Tally trees the way you would on a paper dot-tally sheet, only faster.
- Voice Tally
- Call out species, diameter and product and keep your eyes on the tree. On phones and tablets.
- A tally set up your way
- Diameters by button or keypad to a tenth of an inch. Heights by keypad, pick list, or logs and half-logs. Products called by height or log by log.
- Products by species
- Set product specifications for each species, with minimum and maximum DIB or DBH. Up to 20 products, depending on your plan.
- Tree details when you need them
- Set up custom fields for crown health, status (AGS/UGS), or any other metric.
- Custom plot and stand data
- Add the fields your clients or agency asks for: checklists, pick lists and tables.
- Ecological features
- Regeneration plots, snags, downed woody material by fixed plot, prism or transect with decay class, ground cover, invasives, soft mast, and bird habitat from the Foresters for the Birds lists.
- Field camera
- Plot photos stamped with location, elevation, bearing and slope, attached to the plot they belong to. On phones and tablets.
Maps & GPS
The map is part of the cruise.
Boundaries, stands, plots and tracks share one map, and it keeps working where the signal stops.
“I love the soils, the parcel maps, and the ability to lay out a cruise grid.”
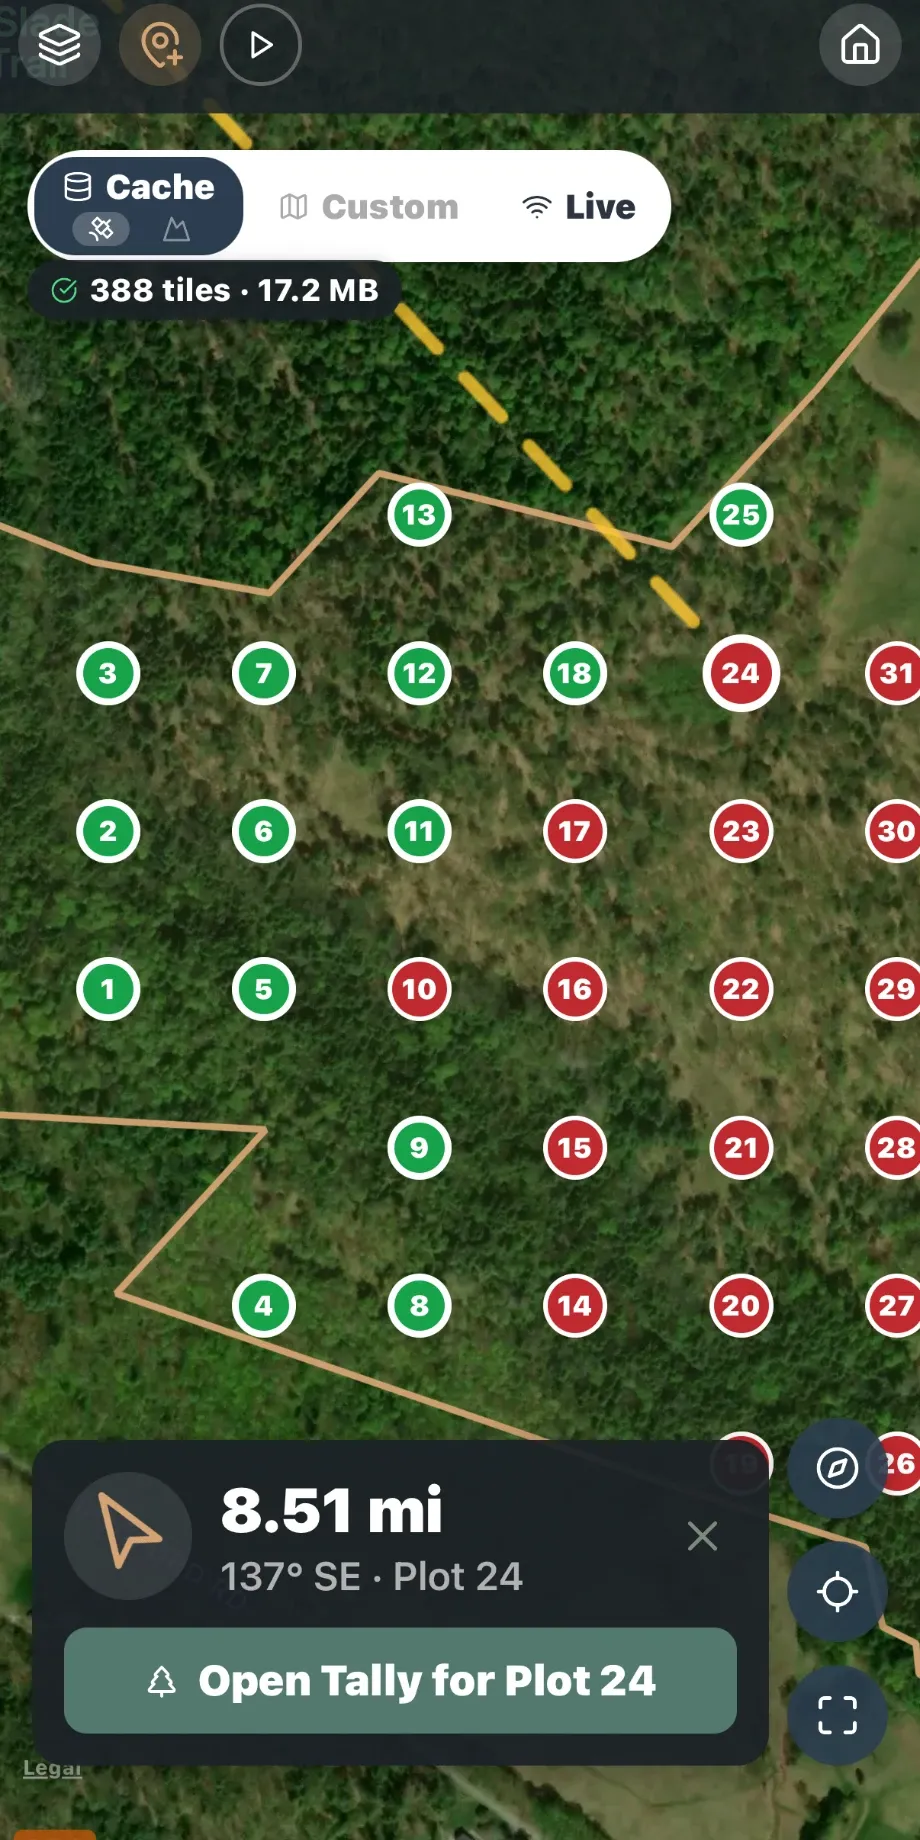
- Boundaries in, stands drawn
- Choose a parcel from the map, import boundaries from KML or GeoJSON, draw manually, or not at all.
- Cruise grid layout
- Set spacing, bearing, and edge buffer. Give it a CV and a confidence level and it tells you how many plots you need.
- Densify stands
- Add plots where you need them: a minimum per stand, a number per acre, or enough to hit a target sampling error.
- Navigation and offline maps
- Walk plot to plot on satellite, topo or street maps saved to the device before you lose signal.
- Waypoints, tracks and stand lines
- Record where you walked and mark what you found, with GPS precision you can tune against battery life.
- High-resolution offline maps
- Save imagery at up to zoom 18 for sharp detail with no signal.
- NRCS soils
- Soil map units and site index by species from the USDA soil survey, and stands split along soil boundaries.
- Parcel lines
- Property lines and owner parcels on the map, and the parcel under any point you tap.
- Your own PDF maps
- Load a georeferenced PDF and use it offline like any other map. Drop Avenza.
- Maps out
- Printable maps of stands, plots, species and tree size, and KML, Shapefile or GeoJSON for your GIS.
The math
The forestry math, no black box.
Standard log rules and taper models, the statistics behind every estimate, and every detail of every tree calculation.
22 seconds to analyze a real 10,008-tree cruise on an iPhone 17 Pro.
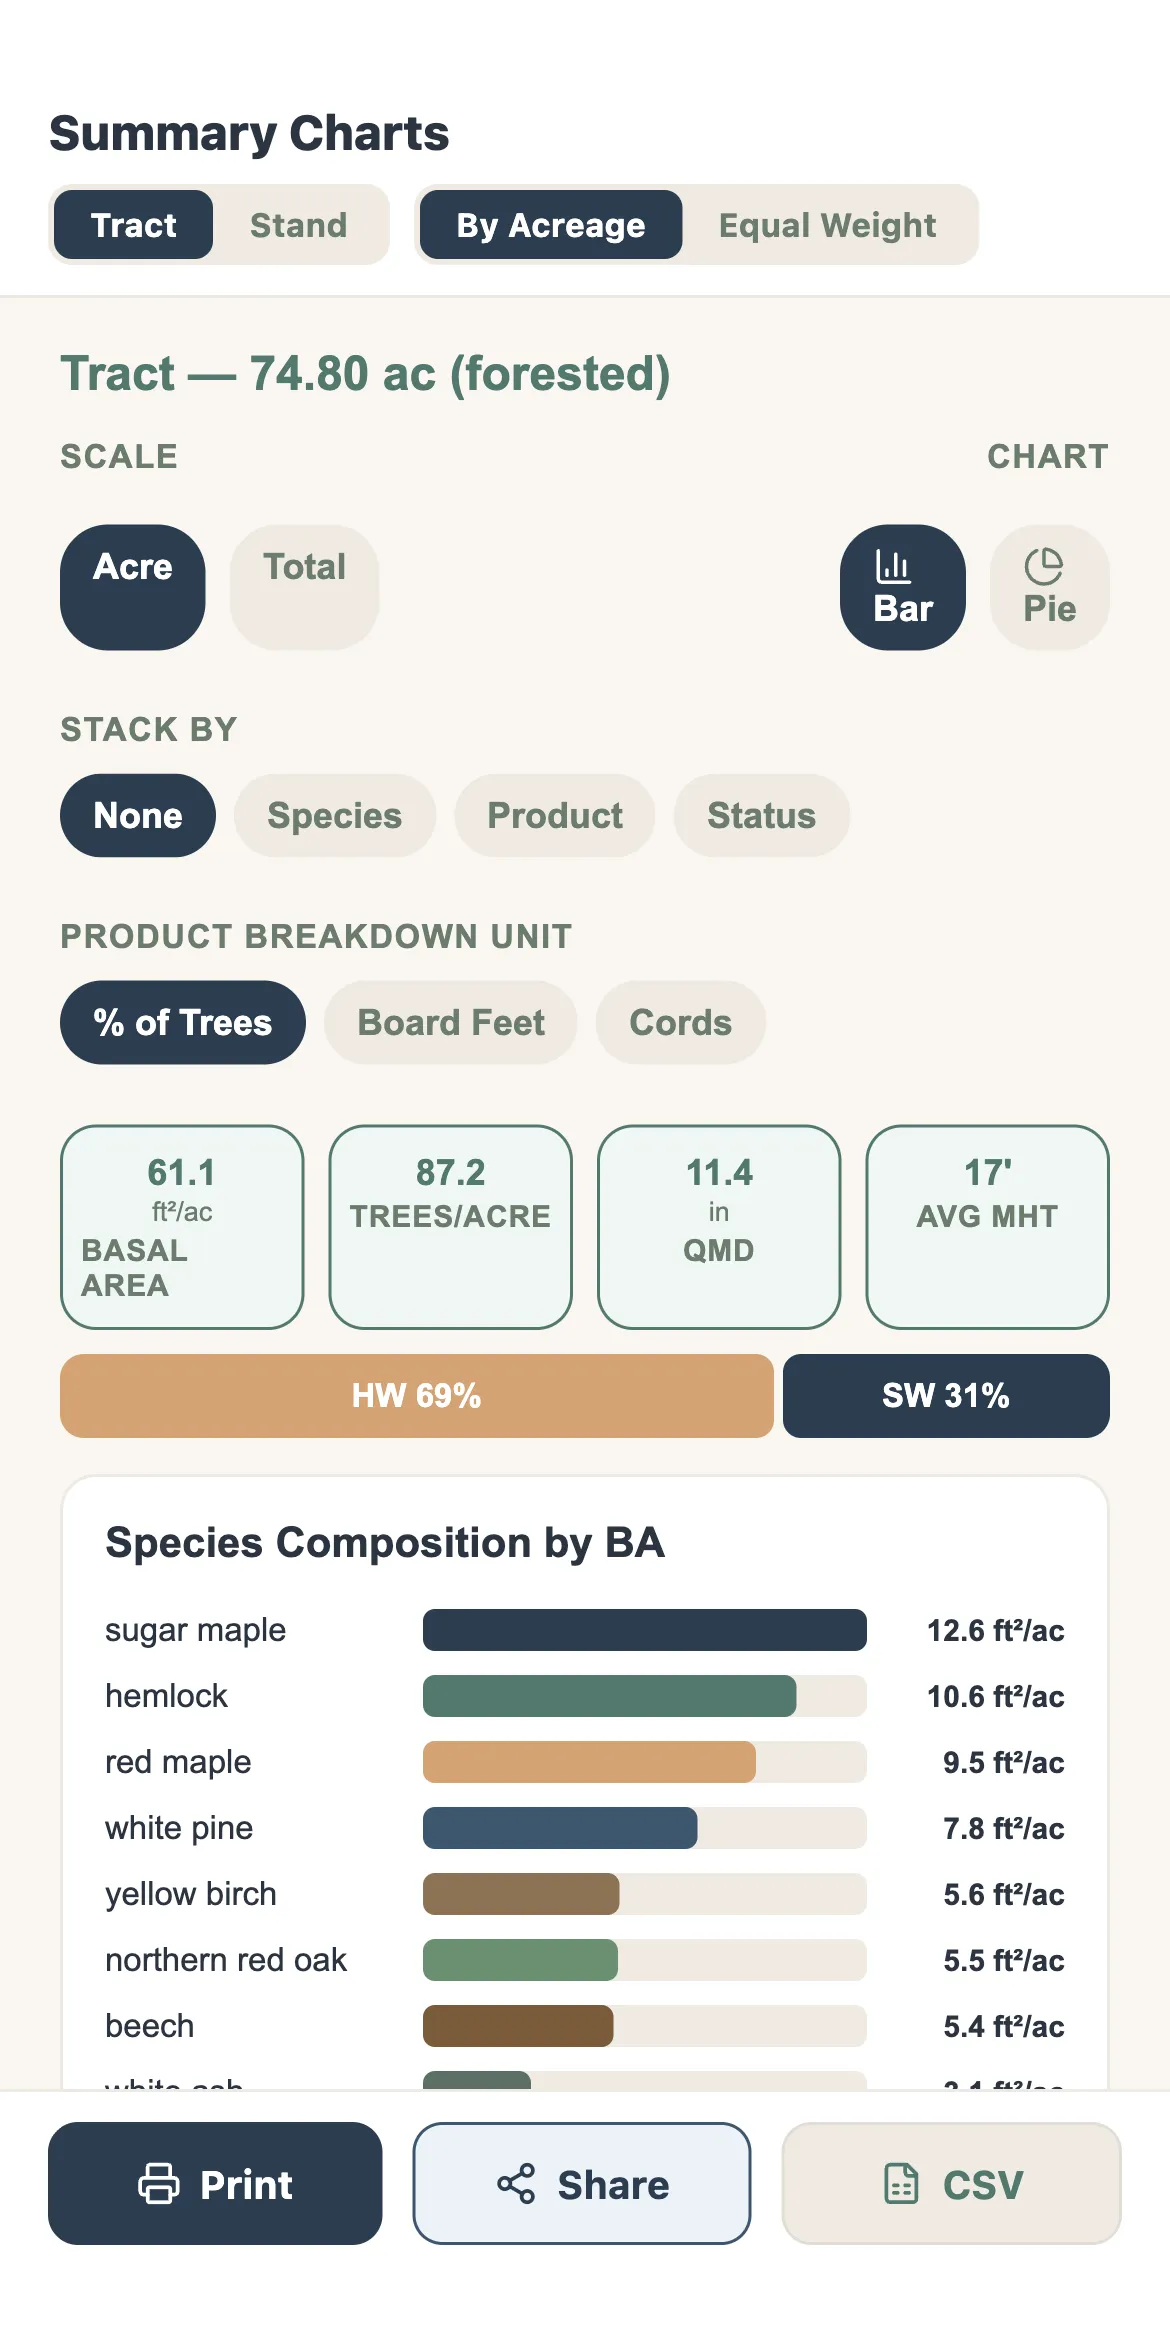
- Log rules and units
- Scribner, Doyle, and International ¼″ and ⅛″. Board feet, cubic feet, cords and tons, gross and net, with optional topwood.
- Taper models
- Mesavage & Girard (Parker 1998) by default, plus Clark & Souter and Behre’s hyperbola.
- Sampling statistics
- Standard deviation, coefficient of variation, standard error and confidence intervals for every stand, plus how many more plots are required to reduce your error.
- Stumpage values
- Prices by product with per-species overrides, carried through to value reports.
- Stand density and stocking
- Gingrich and Leak stocking guides, Reineke relative density and stand density index.
- Carbon and biomass
- Whole-tree biomass for bole, branches and foliage, and roots, reported in dry or green tons, carbon, and CO₂e.
- FIA comparisons
- Compare your stand with Forest Inventory and Analysis plots of the same forest type in your region.
- Custom volume rules
- Import your own volume rules and tables.
Reports
Reports you can understand.
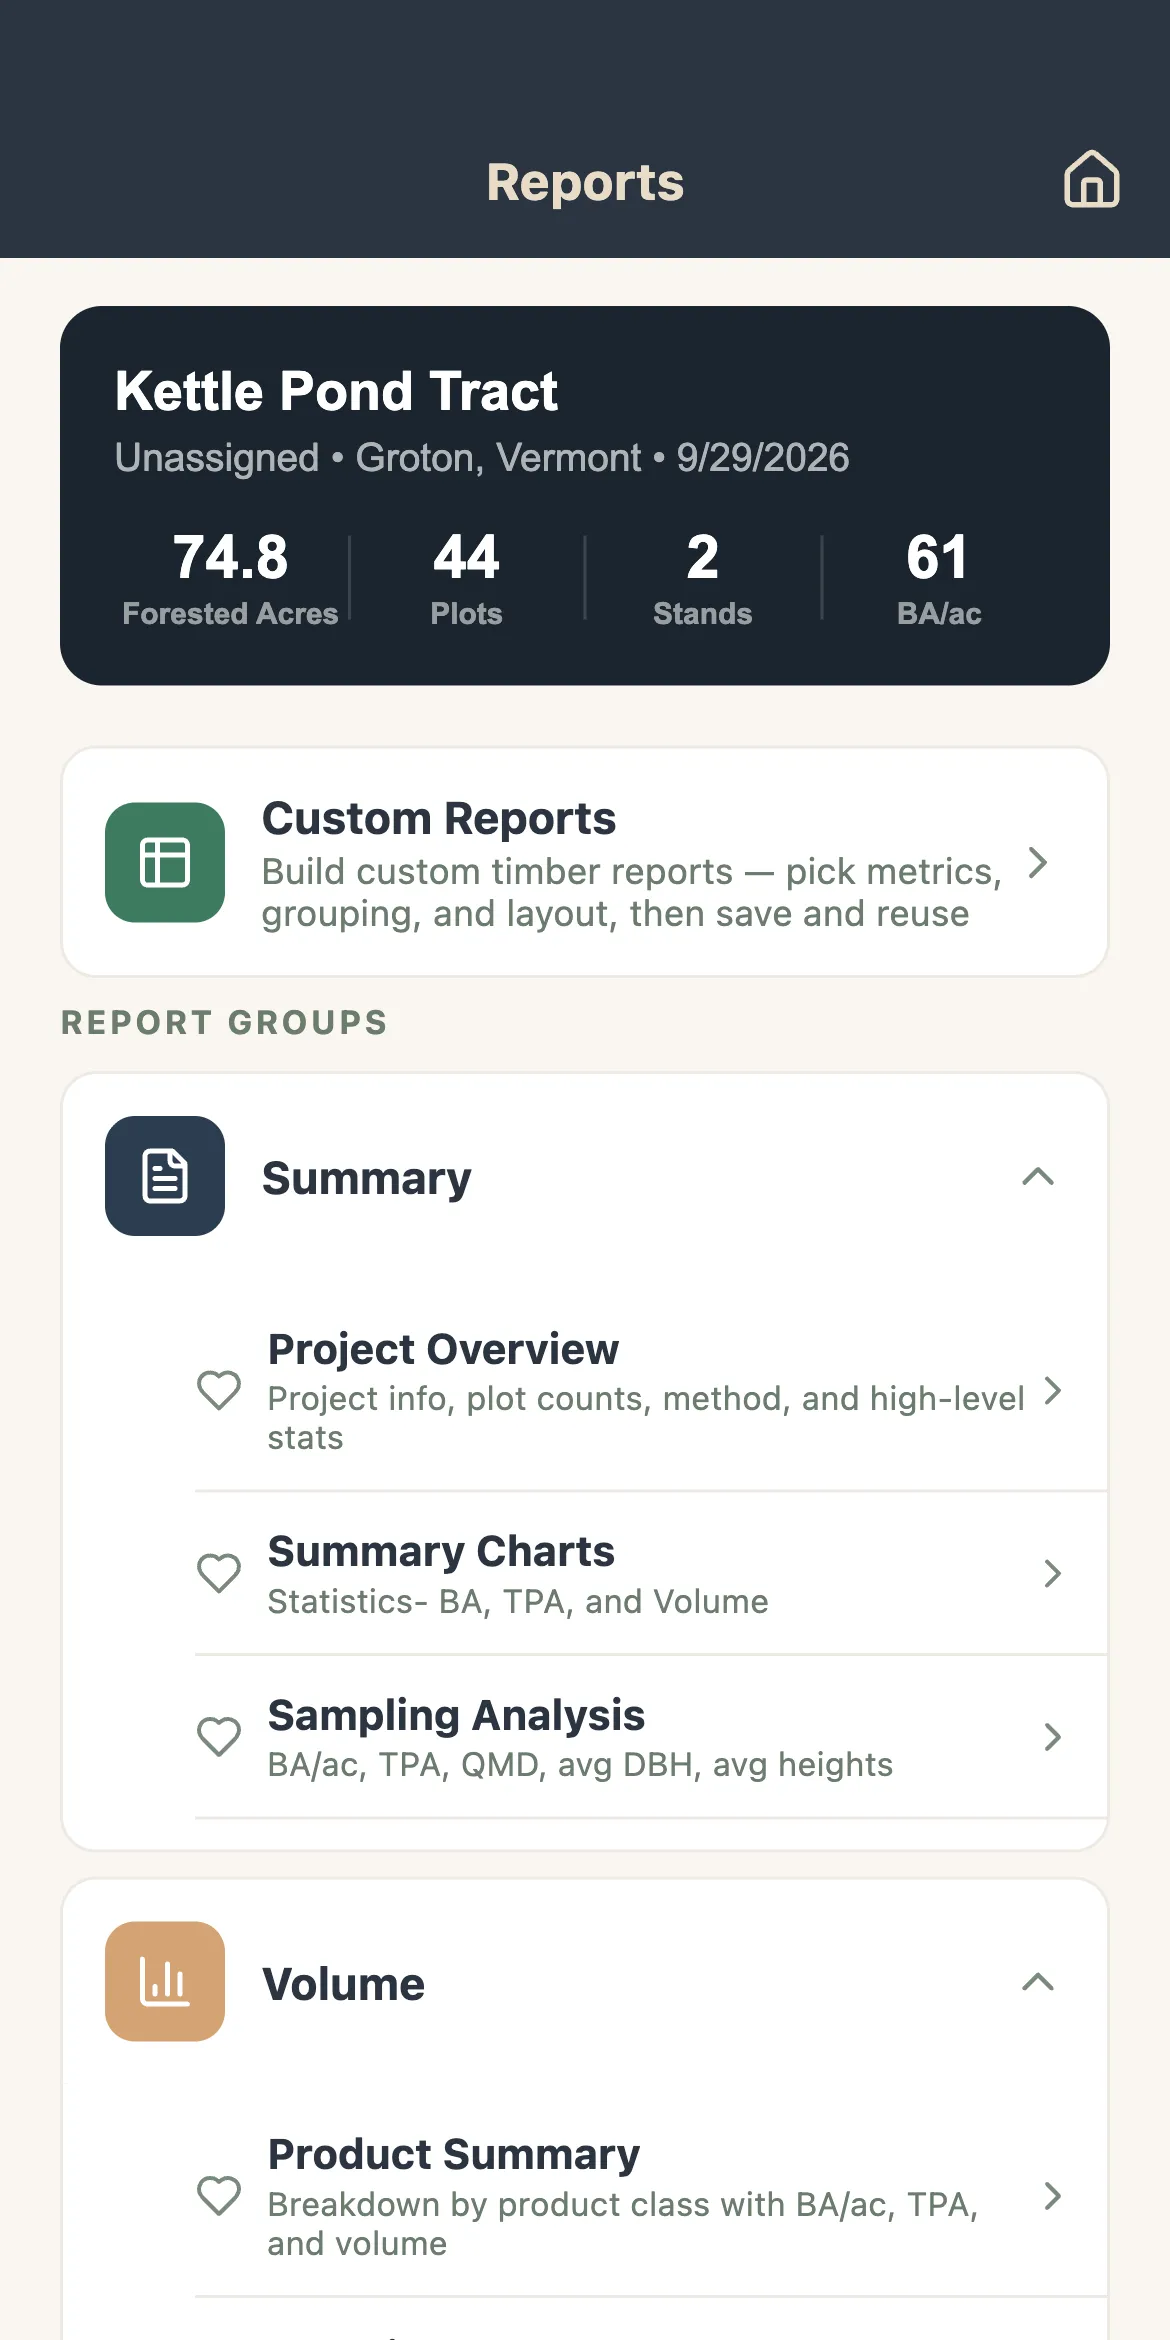
More than twenty crystal-clear reports, each one printable to PDF and exportable to Excel, from the device in the field or the browser in the office.
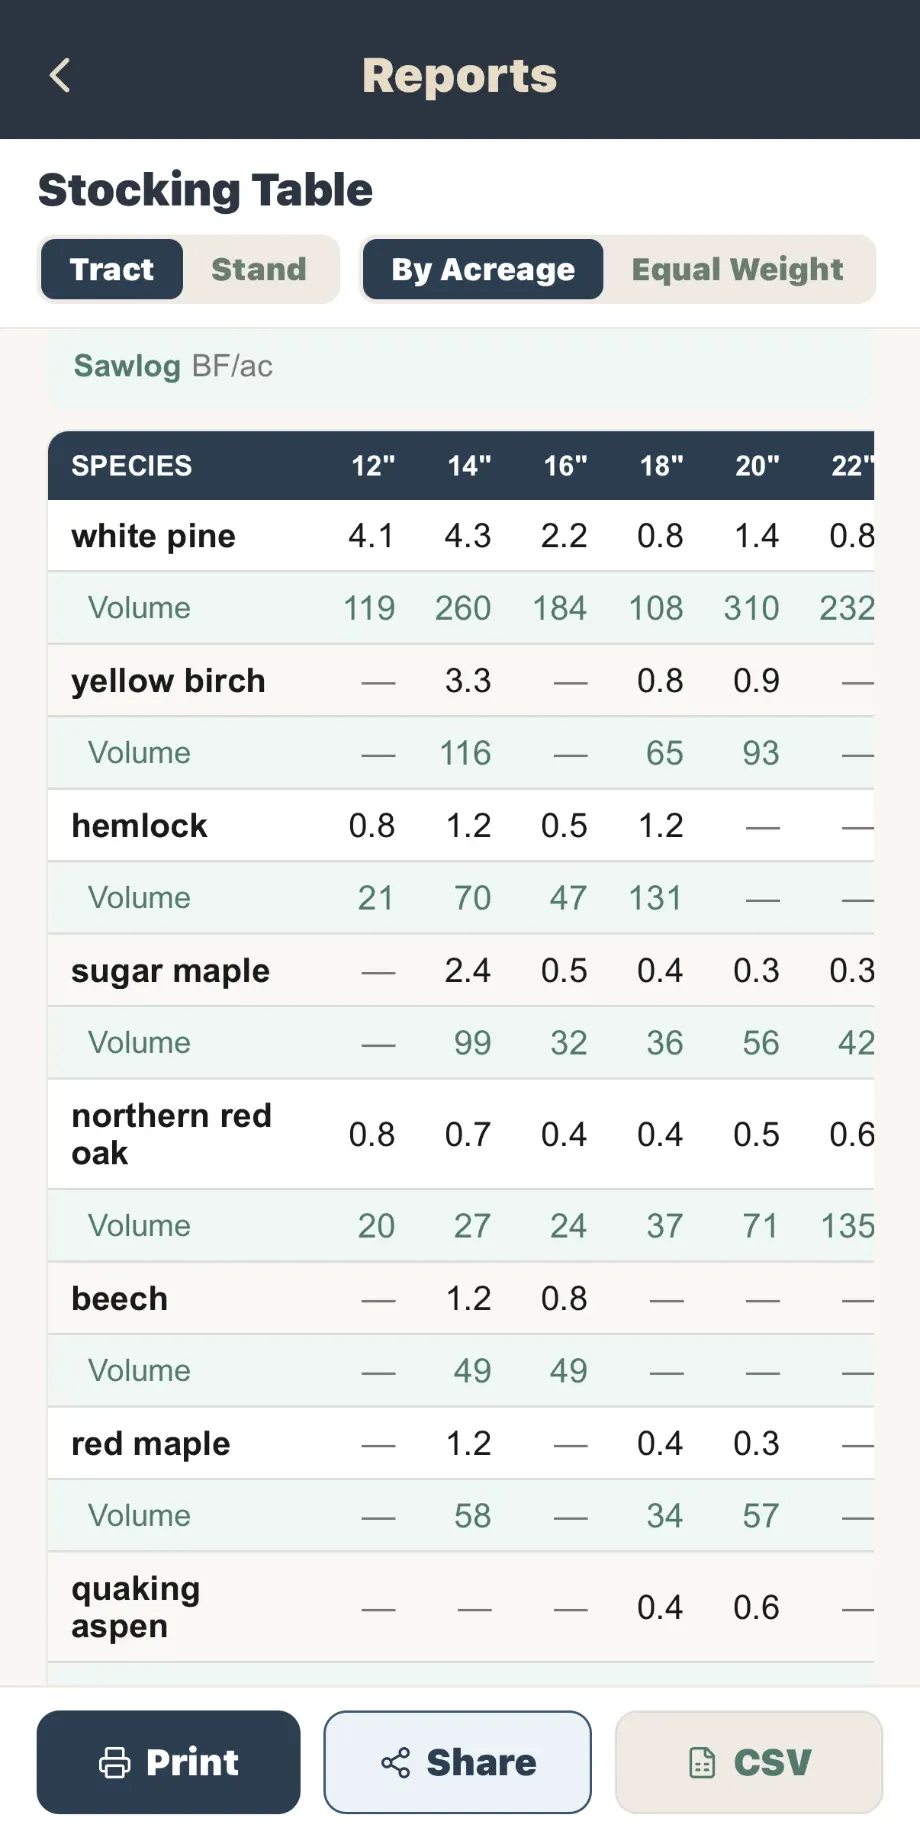
- Summary
- Project overview, summary charts and sampling analysis.
- Dynamic reports
- Full pivot-table style functionality to build exactly the report you need.
- Volume and stocking
- Product summary, stocking tables, diameter distributions and stocking graphs.
- Value
- Product value summary and values by species and product.
- Tree and plot data
- Complete and detailed tree lists, plot observations, and basal area by plot.
- Ecology reports
- Regeneration, downed woody material and snags, in total and by species.
- Report builder and styling
- Build and save your own report layouts, and set fonts and colors to match your business.
- Exports to other software
- Excel workbook of every piece of data and setting, plus exports for SILVAH, NED-3, FVS and FIA.
- Custom management plans and sale prospectus
- Back in the office, documents fill themselves in from the data, with room for your own narrative. (Optional paid upgrade)
Office & team
The office is a web browser.
Everything from the field is backed up and waiting in the office by the time you get there.
“It is reducing my field time and office time tremendously.”
- Automatic cloud sync
- Data is stored locally and syncs to the cloud automatically. No cables, no file copying, and no additional software.
- Office pages
- Your clients and their parcels, shared cruises and reports, in any web browser.
- Share a project
- Share a project or a template with any FM user, as an editor or a viewer, and revoke access at any time.
- Organizations and roles
- Owners, admins, cruisers and viewers, with invitations by email.
- Devices
- One active device per license, log in on any phone or tablet.
- Import data from Excel
- Bring data in from an Excel workbook, with species and products automatically matched as you go.